KOMODO
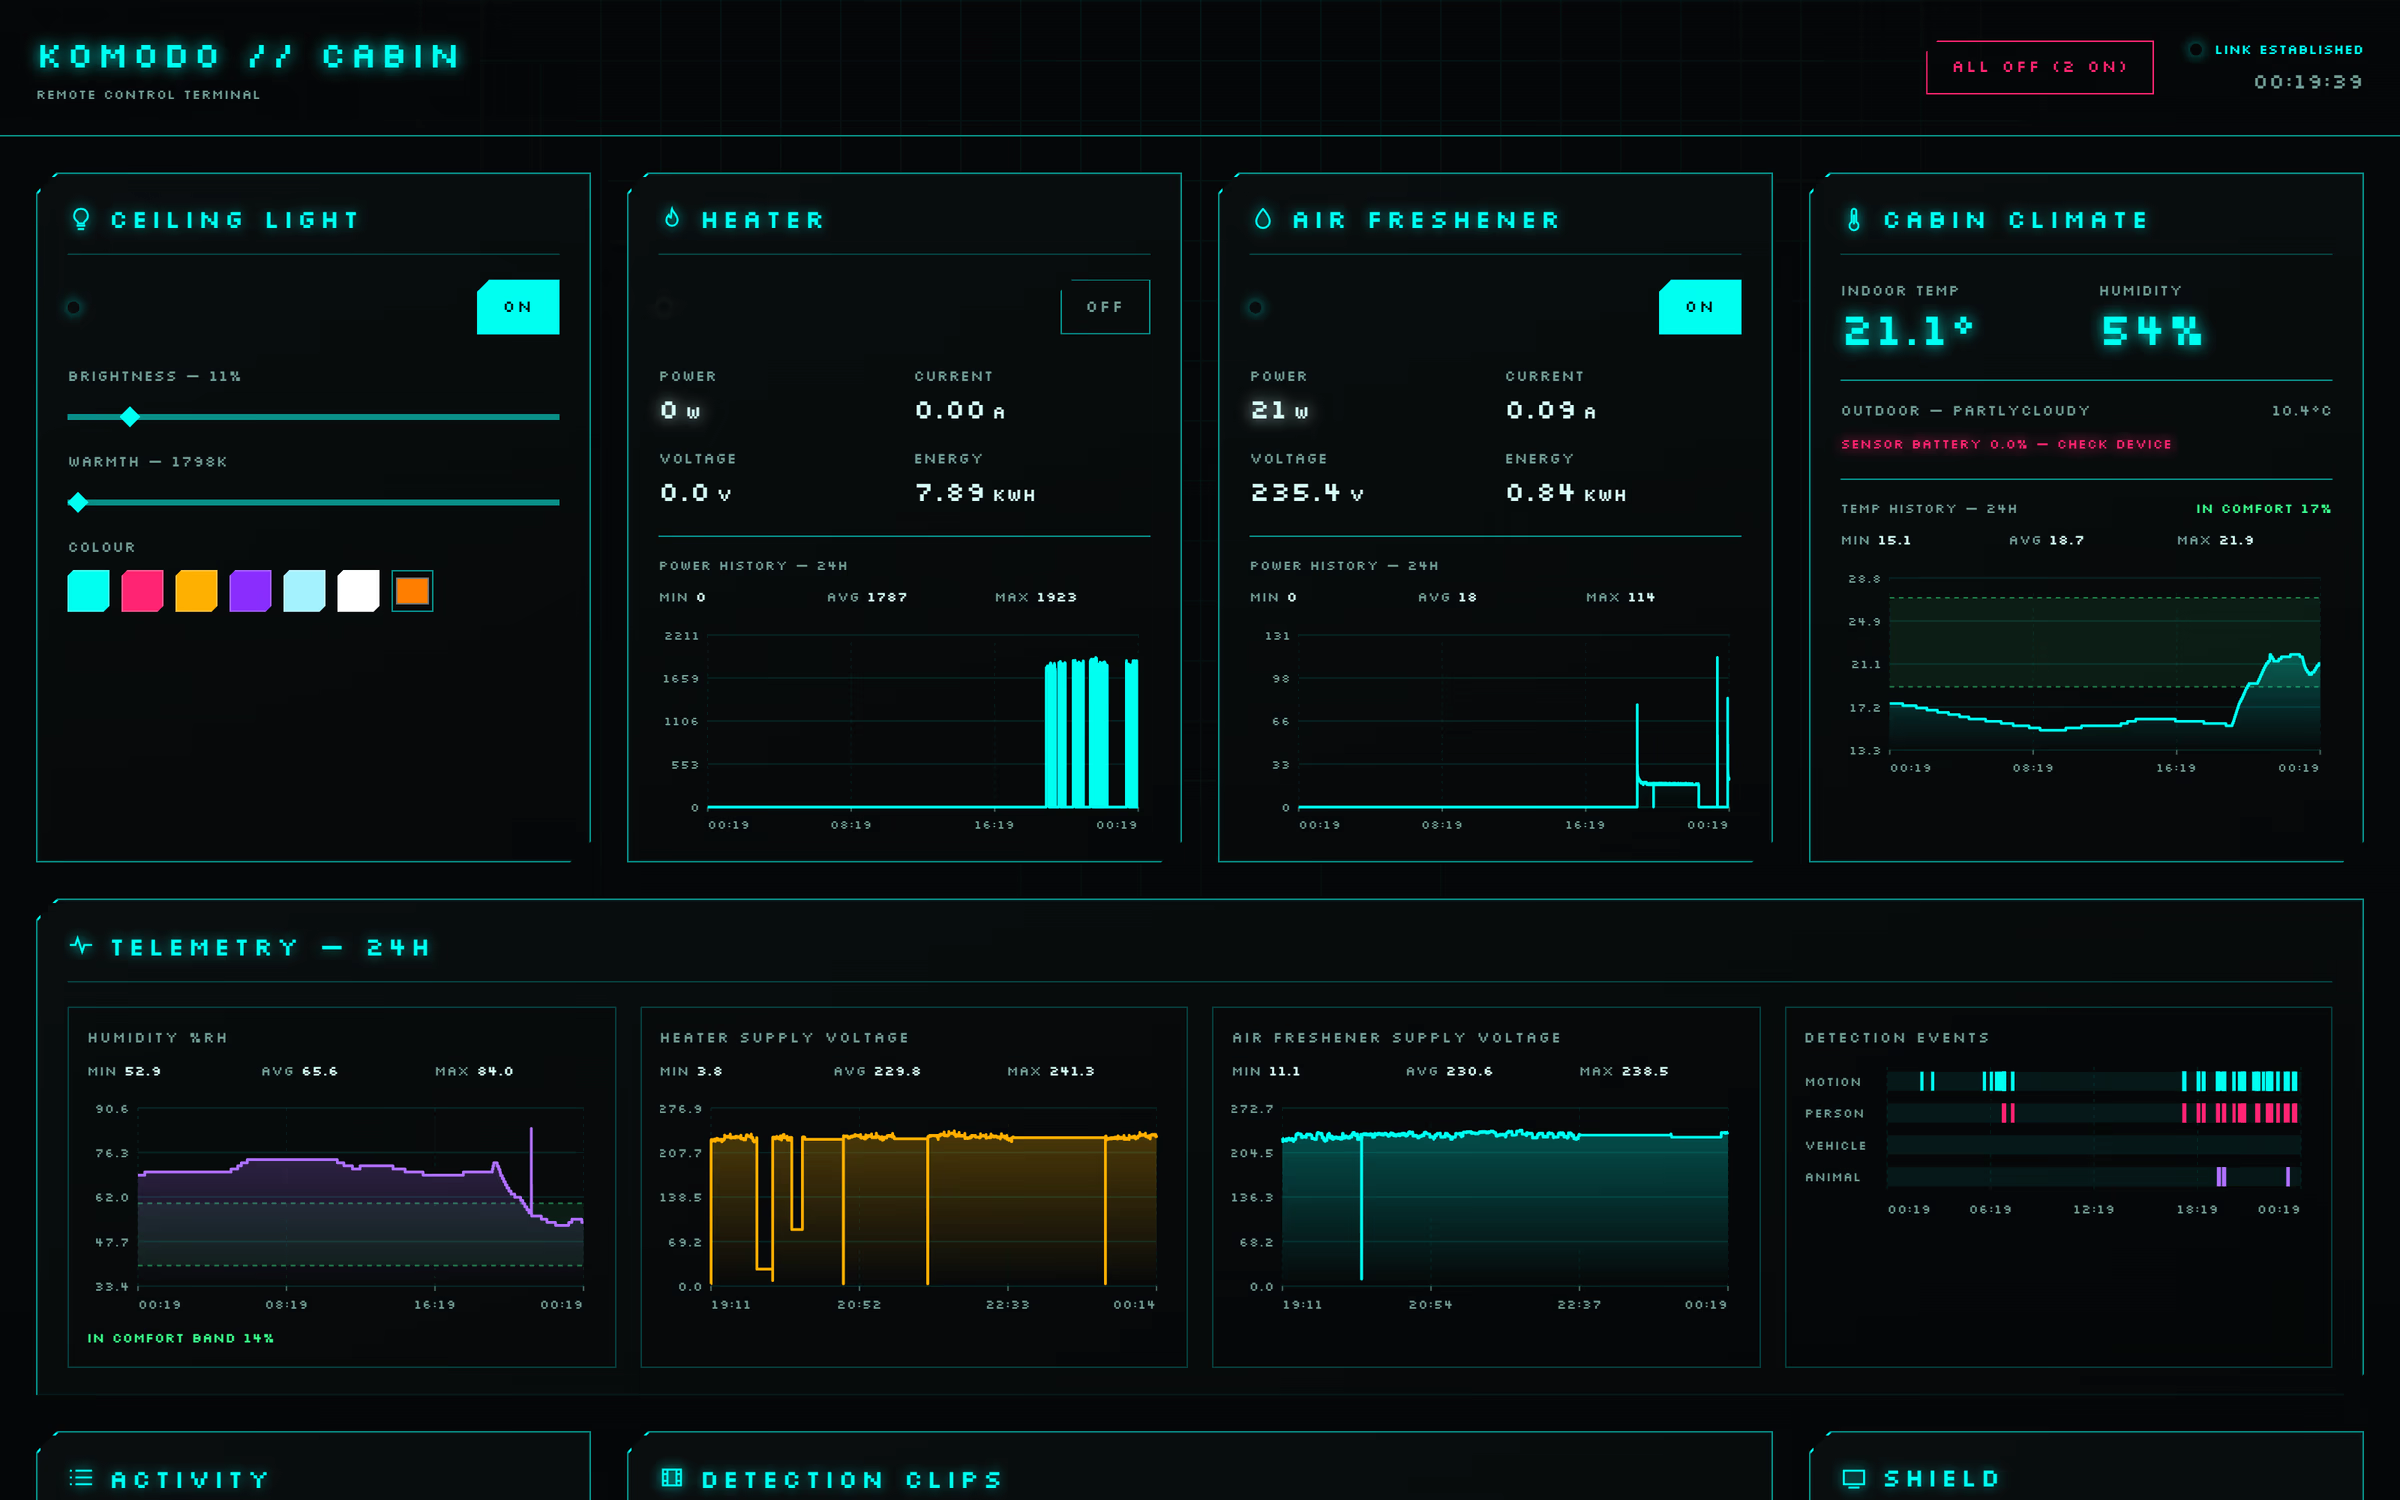
A game-HUD-styled control terminal for a real garden cabin. Live device control, camera detection clips, energy analytics and network monitoring, built on top of Home Assistant and styled like something out of Destiny or Cyberpunk.
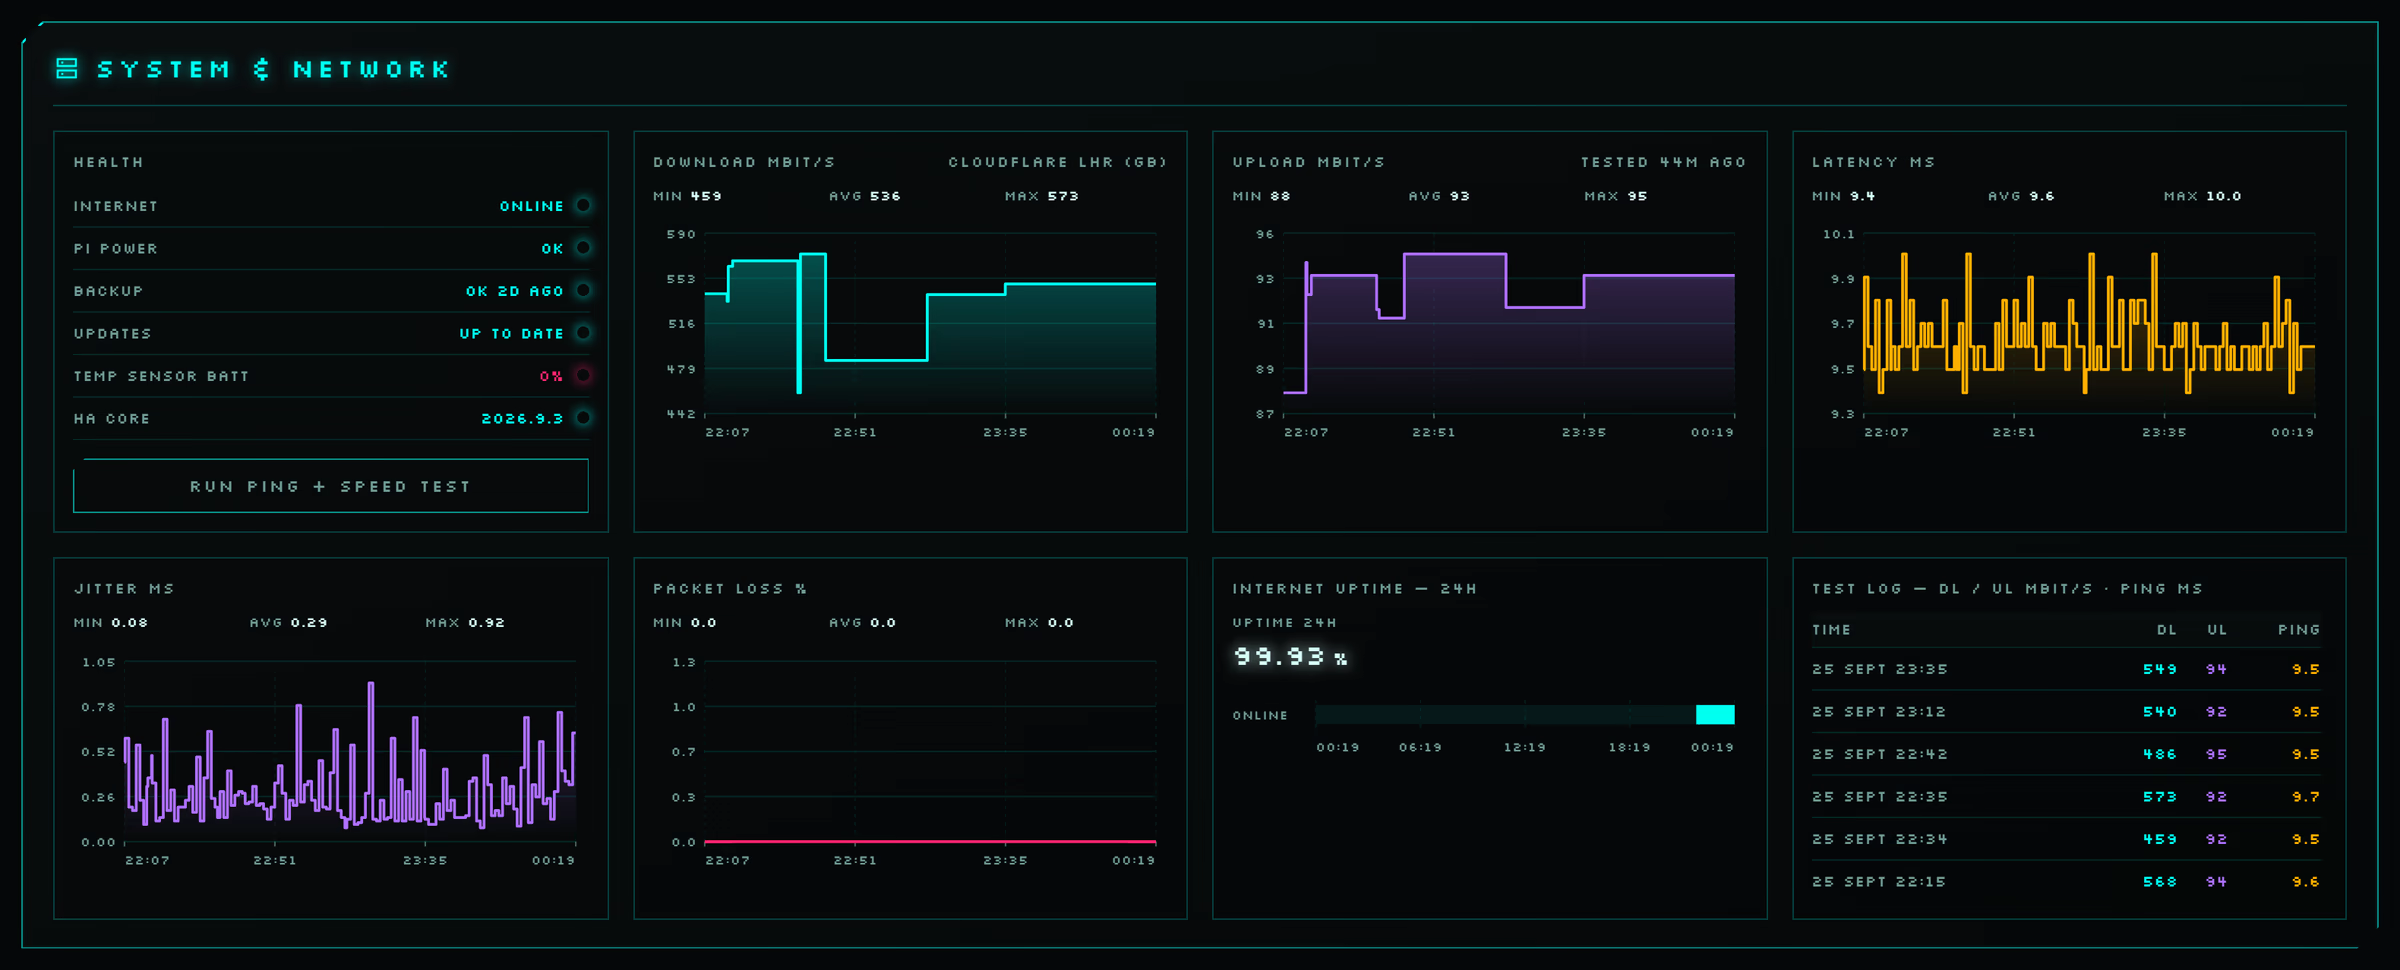
Every reading on this page is live data from the cabin, captured on the night of 25–26 September 2026.
A Cabin With
A Control Terminal
Home Assistant runs on a Raspberry Pi inside the cabin. Its stock interface works, but it looks like a settings screen. Komodo replaces it with a purpose-built dashboard: near-black panels, neon cyan accents, chamfered corners, scan lines and the Silkscreen pixel font throughout.
The device list is deliberately small: one light, two smart plugs, one camera, one climate sensor and a media player. The depth comes from what the dashboard does with them: hand-built telemetry charts, heating and energy analytics, weather and frost alerts, detection clips, and a custom Home Assistant app that measures the cabin's internet connection.
Devices
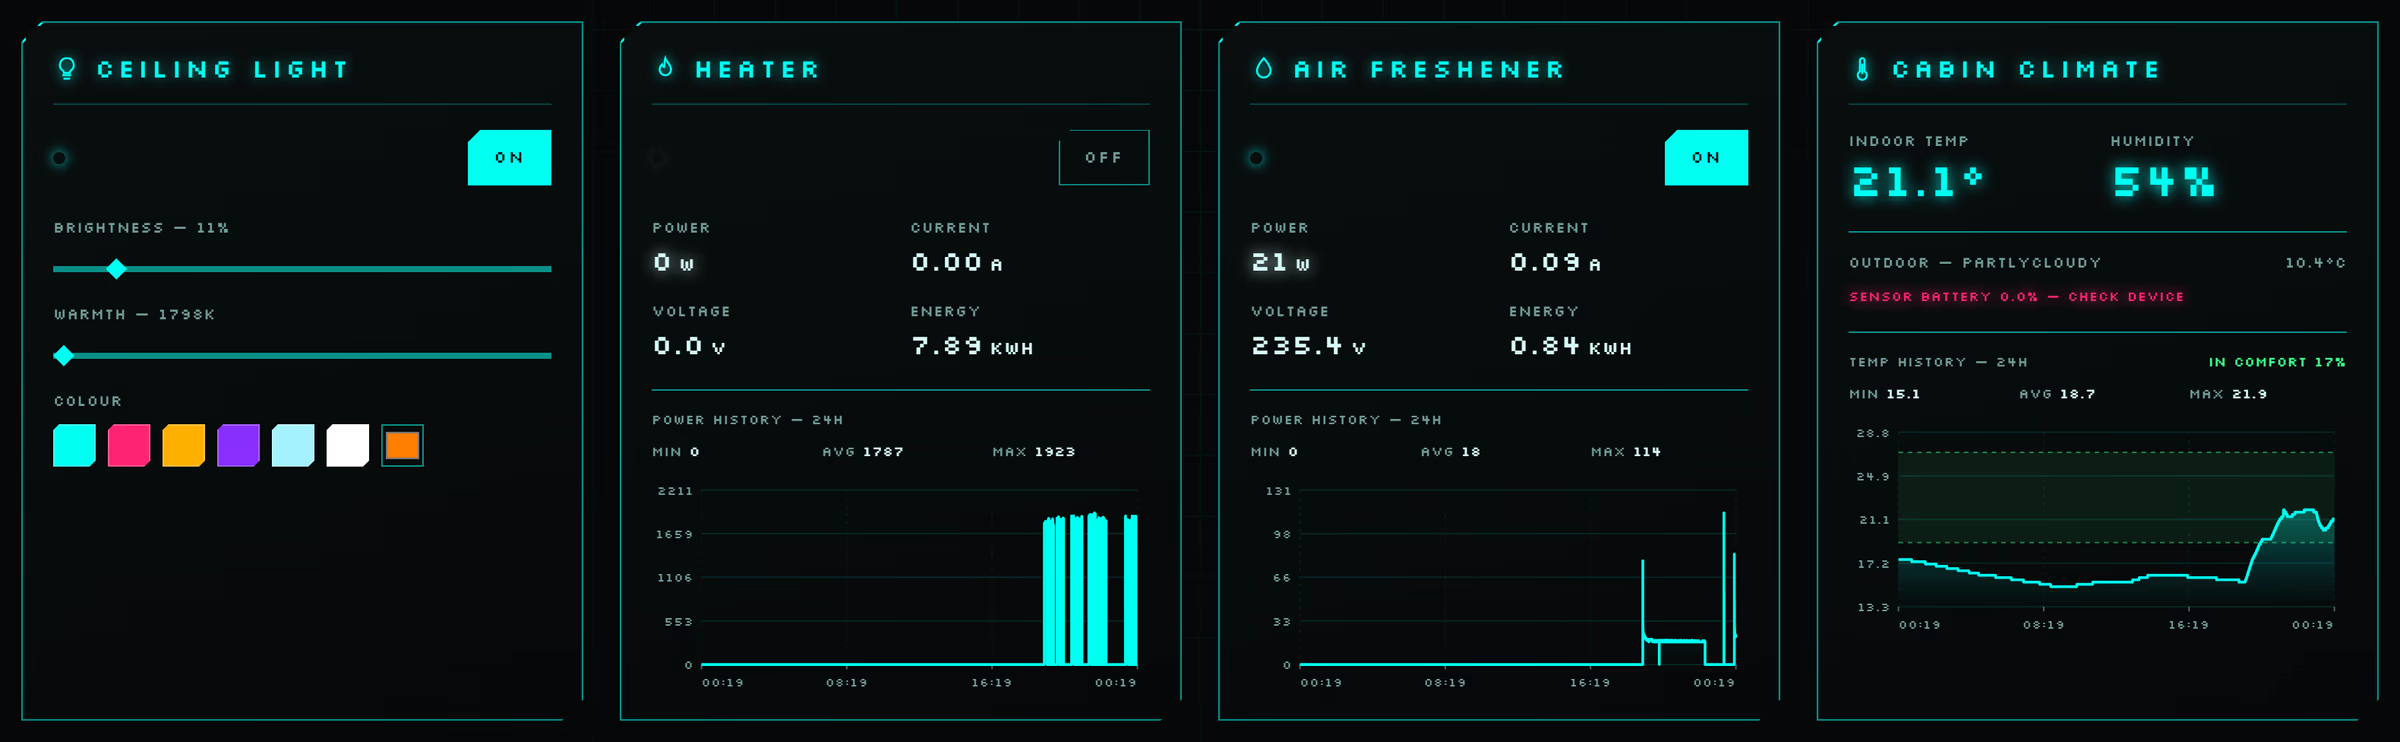
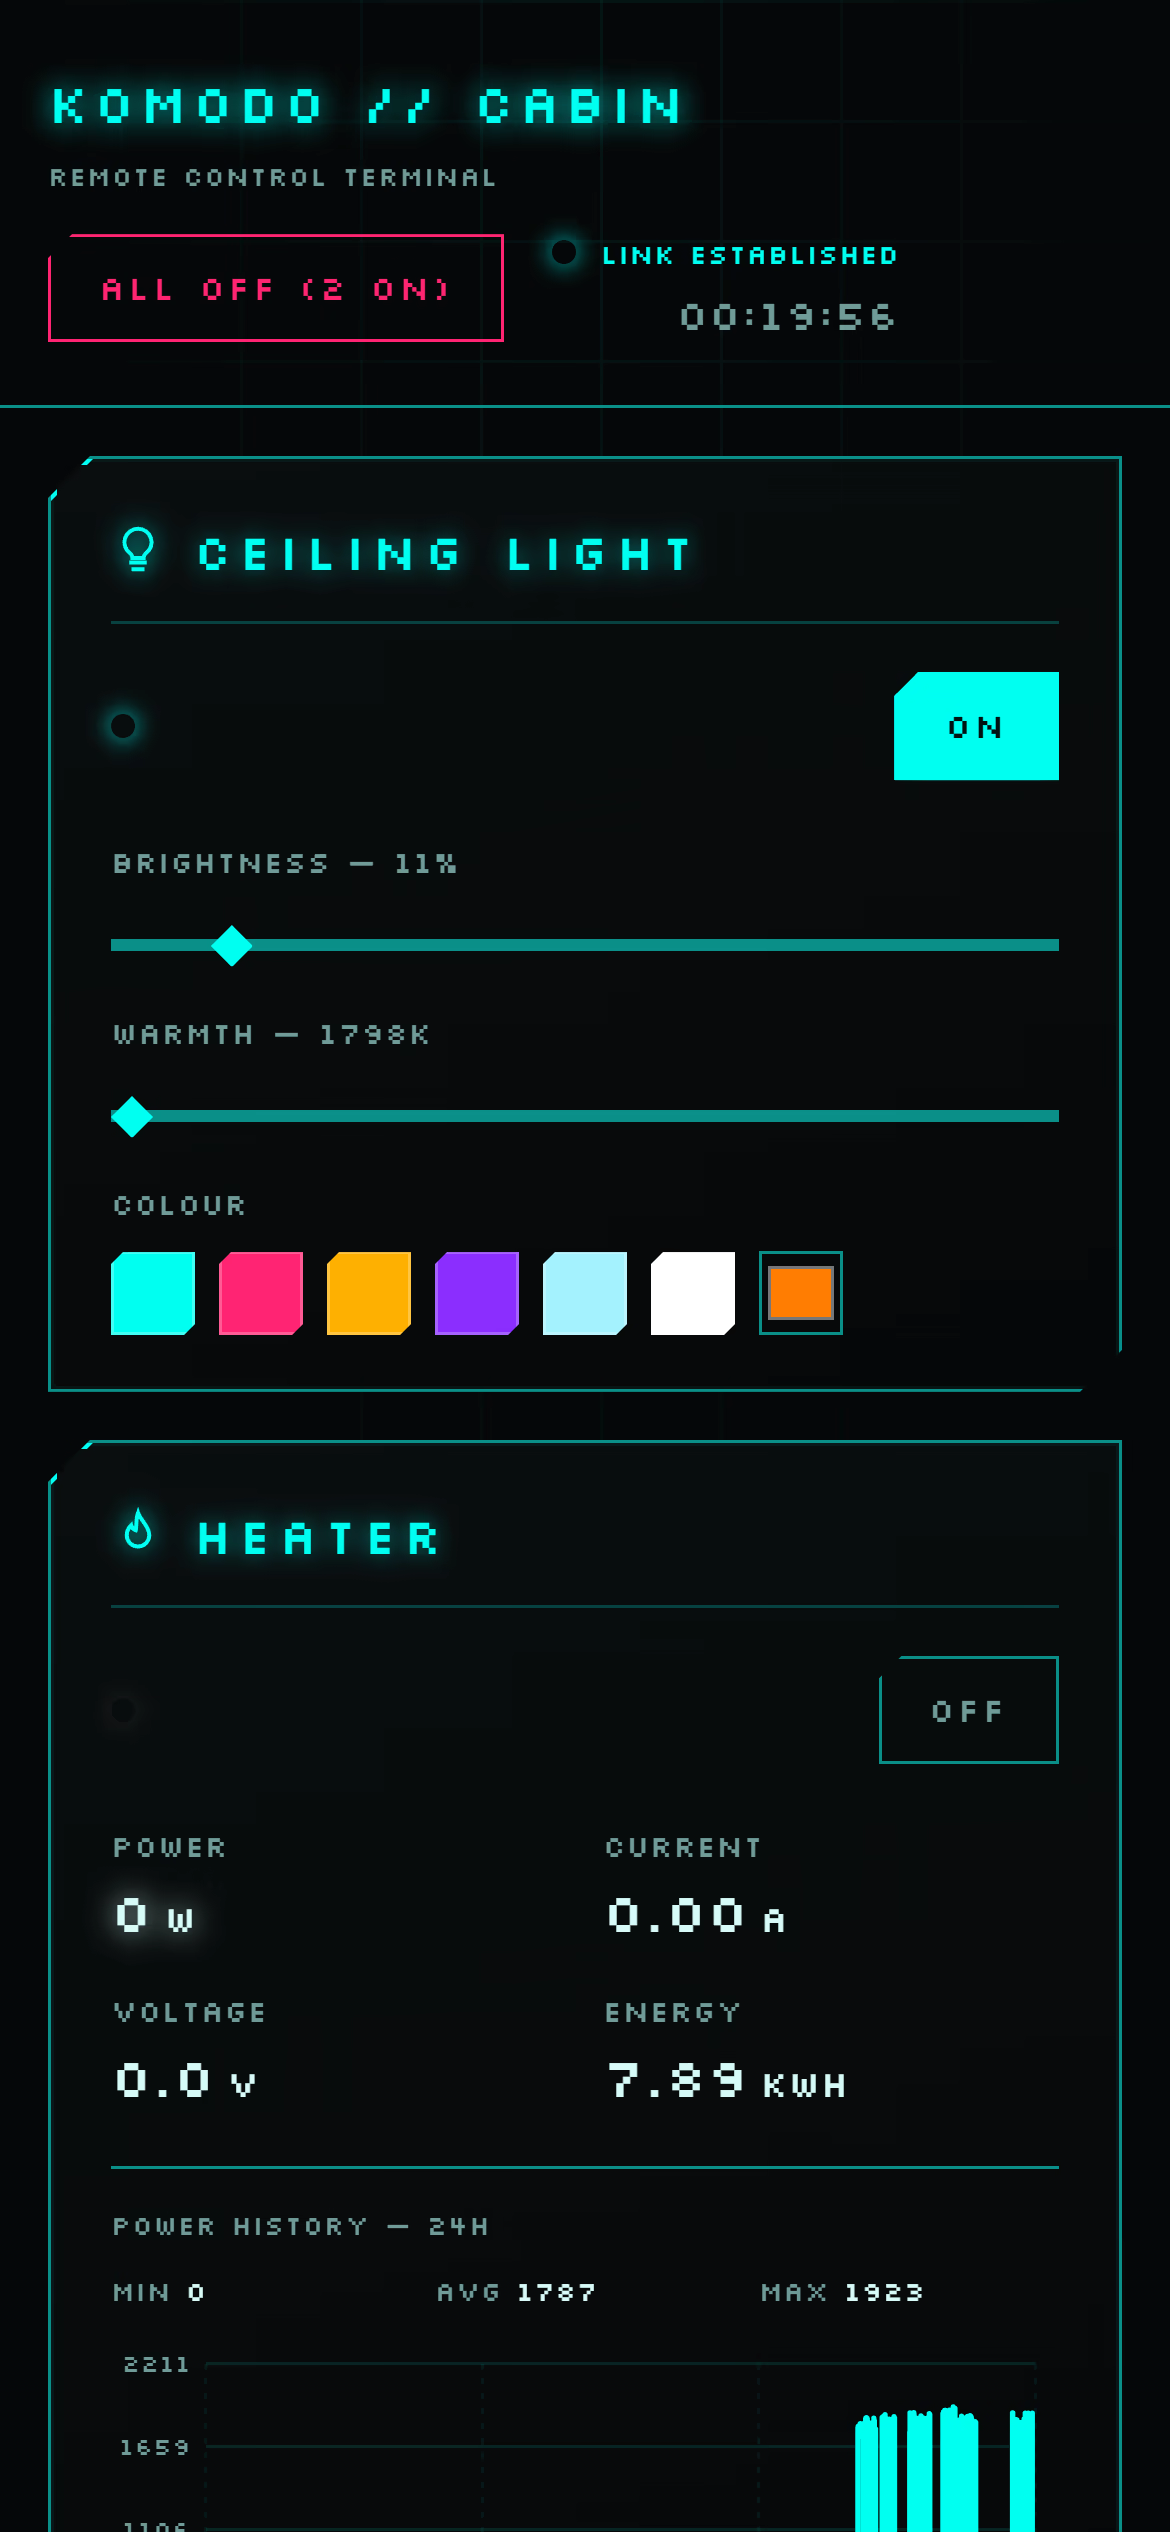
Every mains device is one tap away. The ceiling light has brightness and warmth sliders, six neon presets and a custom colour picker. The heater and air freshener are power-monitoring smart plugs, so each card shows live watts, amps, volts and cumulative energy with a 24-hour power history. A single ALL OFF button in the header shuts everything down and reports how many devices are still on.
Charts Without
A Chart Library
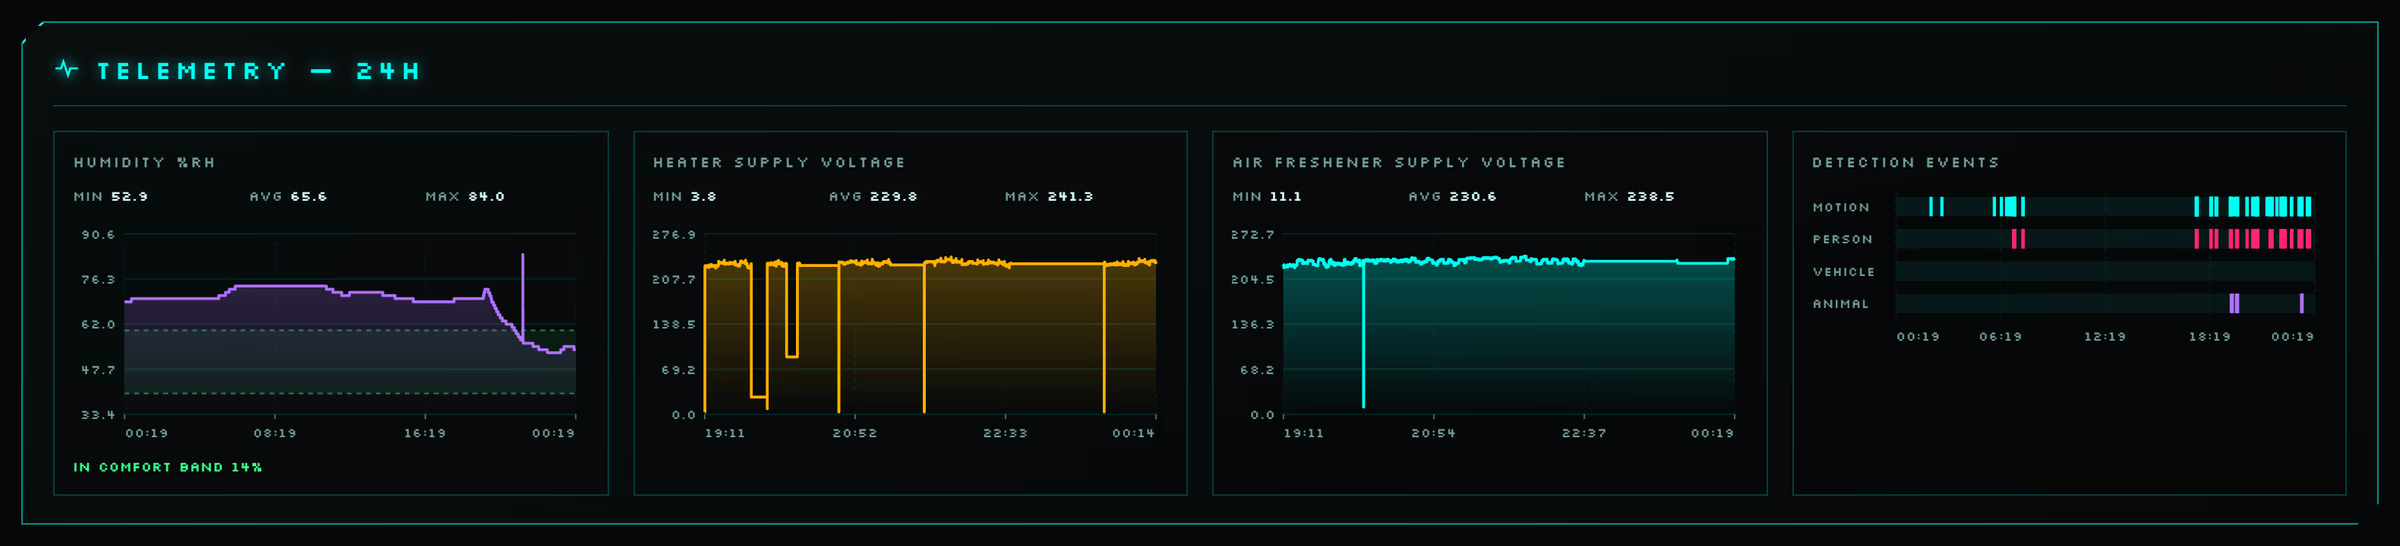
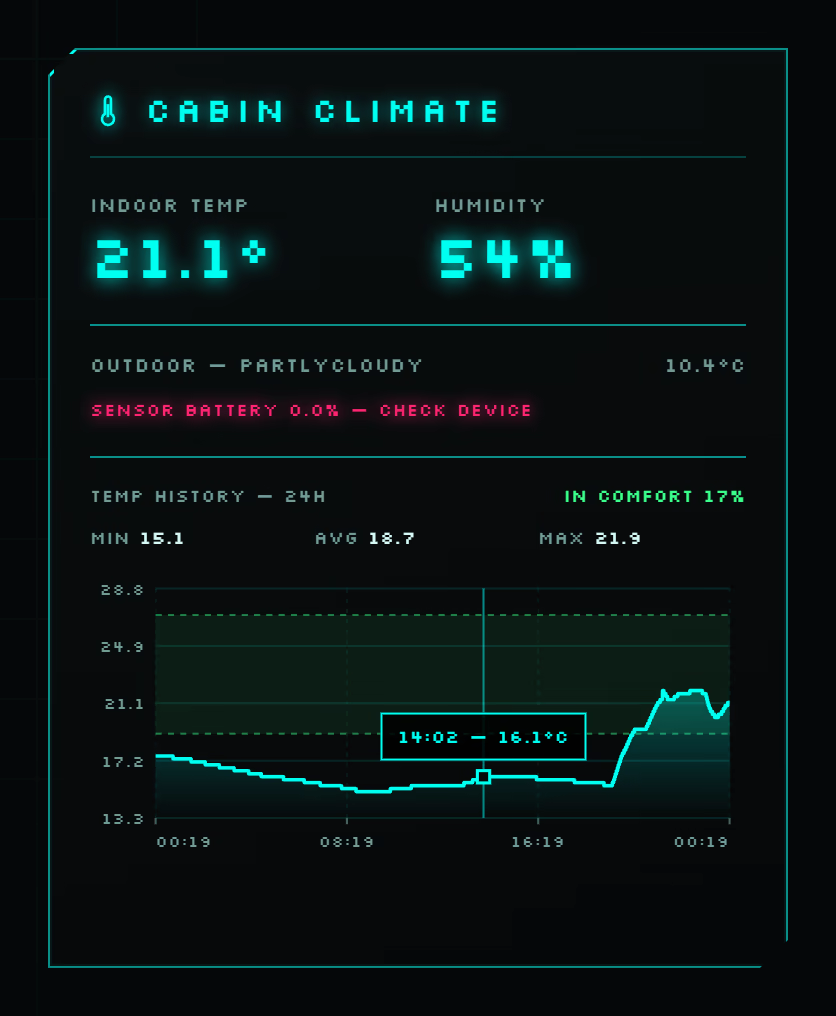
Every chart is a custom SVG component. They share a consistent "scientific" treatment: min / avg / max readouts, dashed grids, time-axis ticks, gradient fills, a square hover marker with tooltip, and an optional green comfort band showing the percentage of time spent in range. Detection events from the camera are drawn as binary state timelines for motion, person, vehicle and animal.
What It Shows
Climate
Indoor temperature and humidity against a comfort band, outdoor conditions, and a warning when the sensor battery runs low.
Heater Analytics
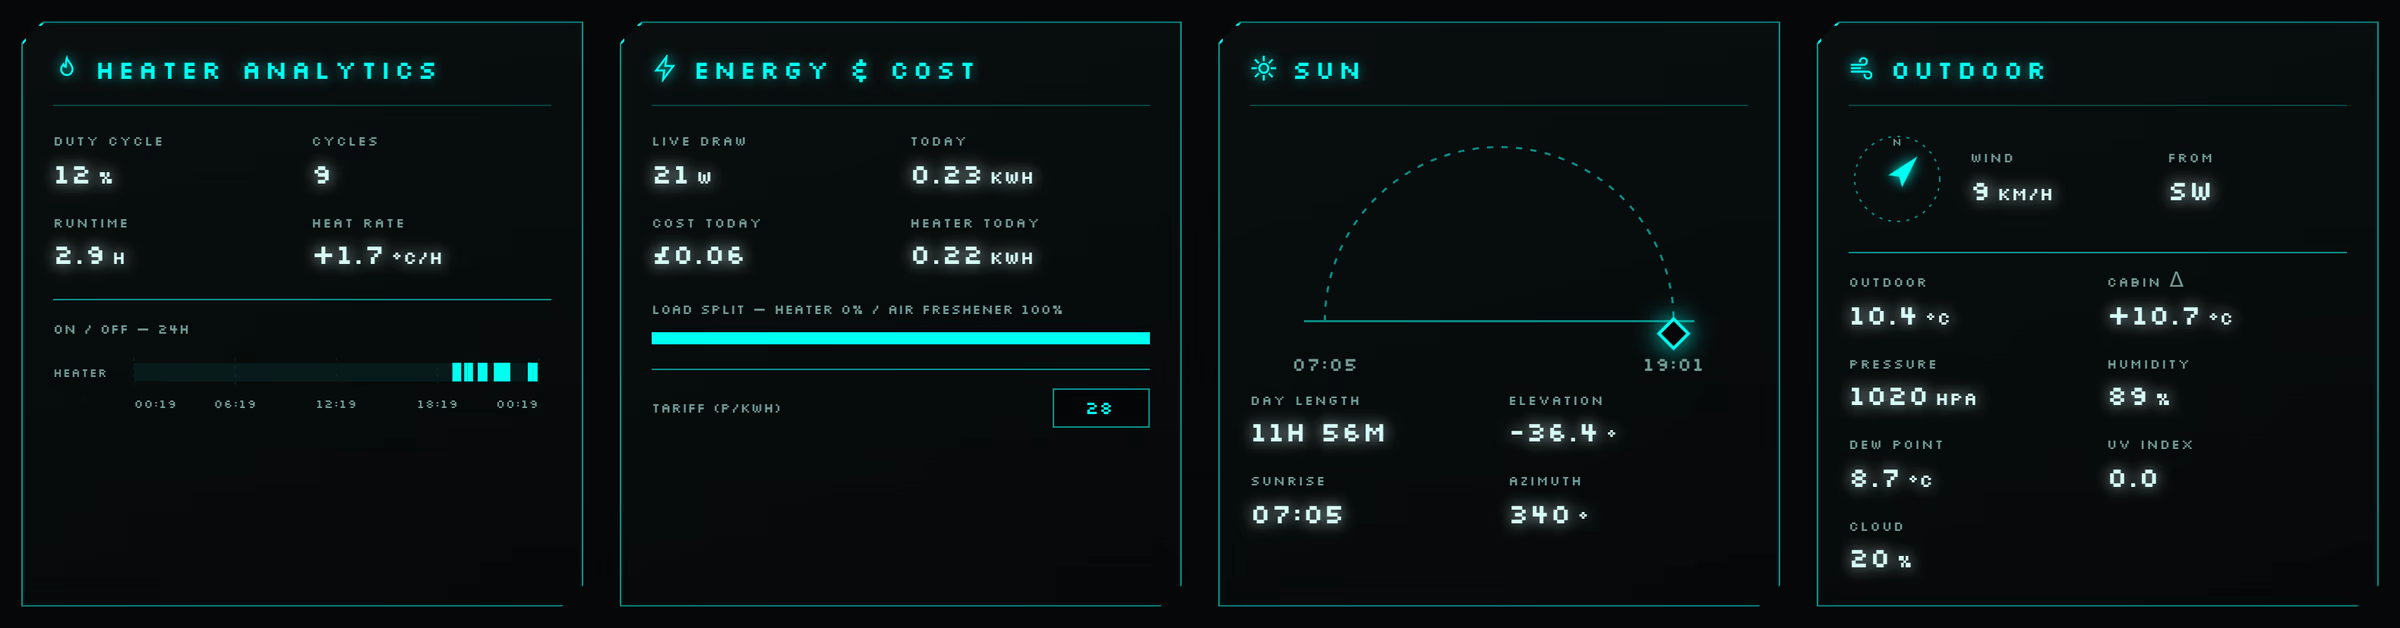
Duty cycle, on/off cycles, runtime and heating rate in °C per hour, derived from heater-on periods against the temperature history.
Energy & Cost
Live draw, kWh and cost today with an editable tariff, plus a heater-versus-air-freshener load split.
Forecast & Frost
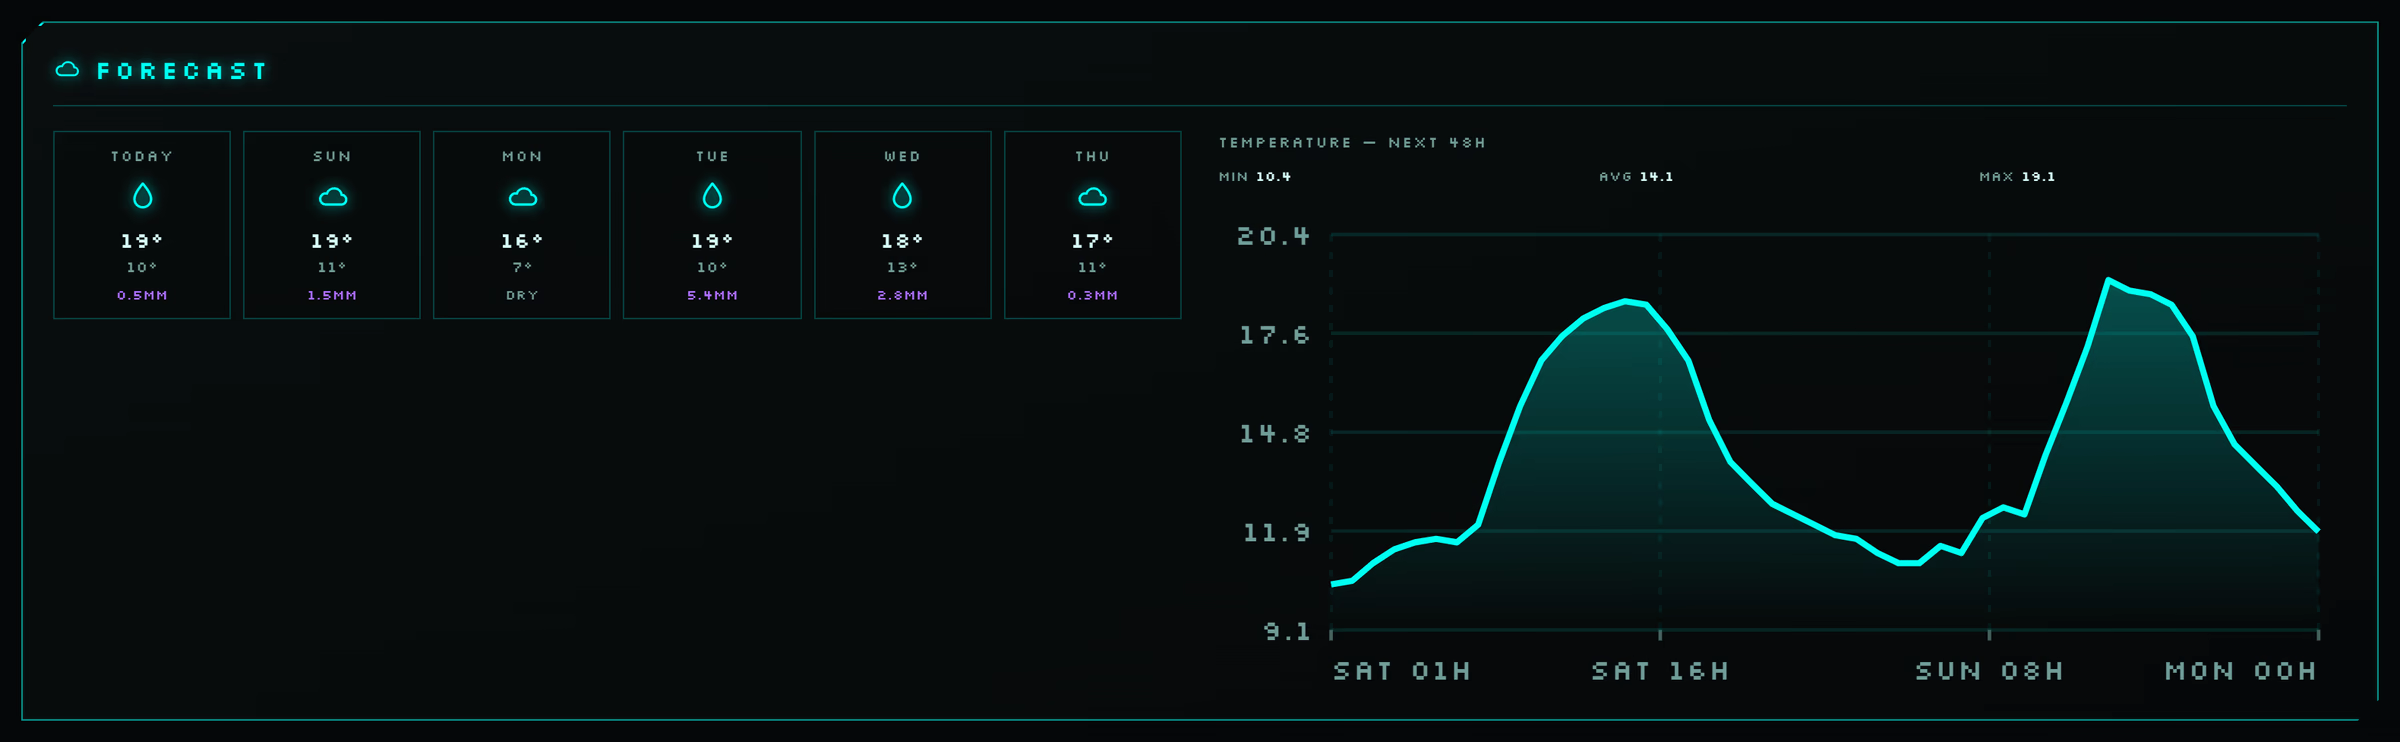
A 6-day outlook and 48-hour chart. A page-wide banner warns when the forecast low reaches 2 °C, and escalates at 0 °C.
Detection Clips
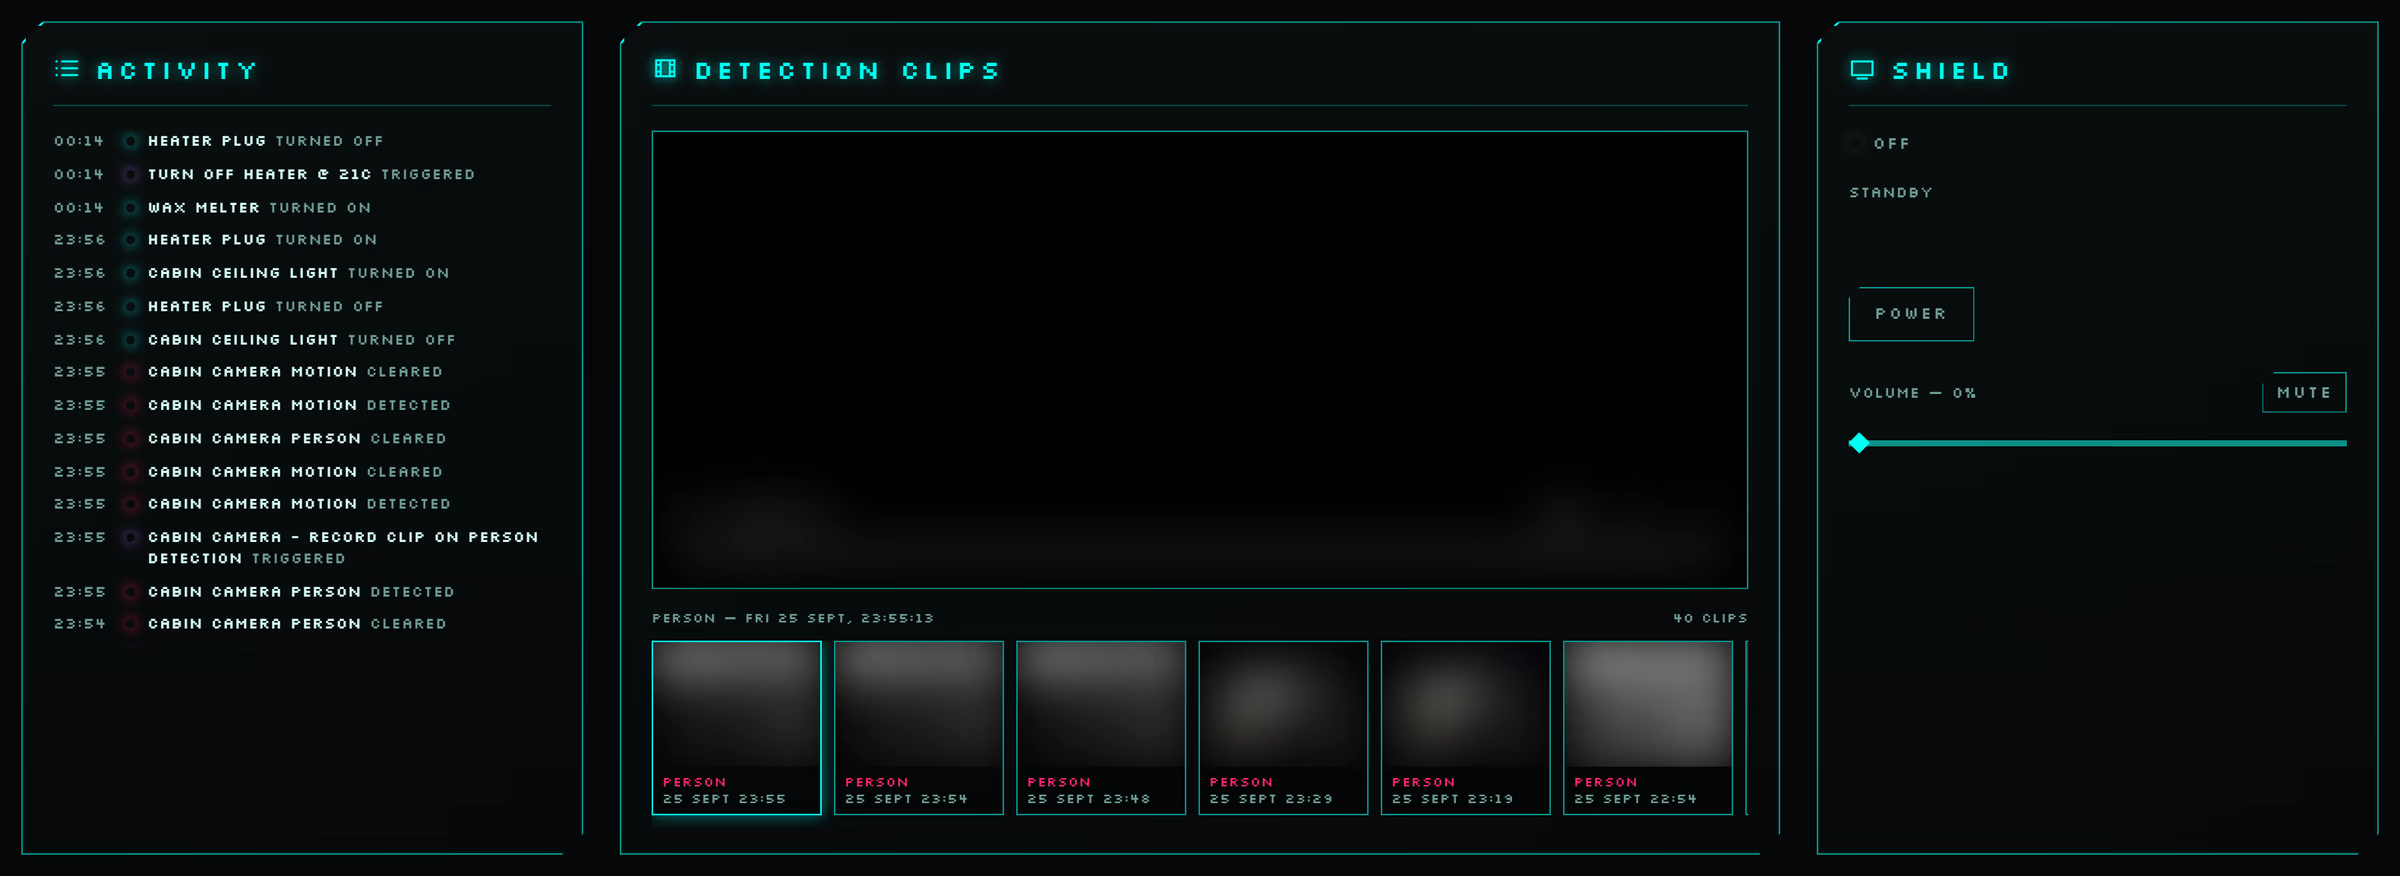
Ten-second clips recorded whenever the camera sees a person, listed newest first with lazy thumbnails and an inline player.
Activity
A colour-coded 24-hour log of device switching, automations firing and camera detections, built from the Home Assistant logbook.
Outdoor & Sun
Wind compass, pressure, dew point, UV and cloud cover, alongside a sunrise-to-sunset arc marking the sun's current position.
Camera & Automations
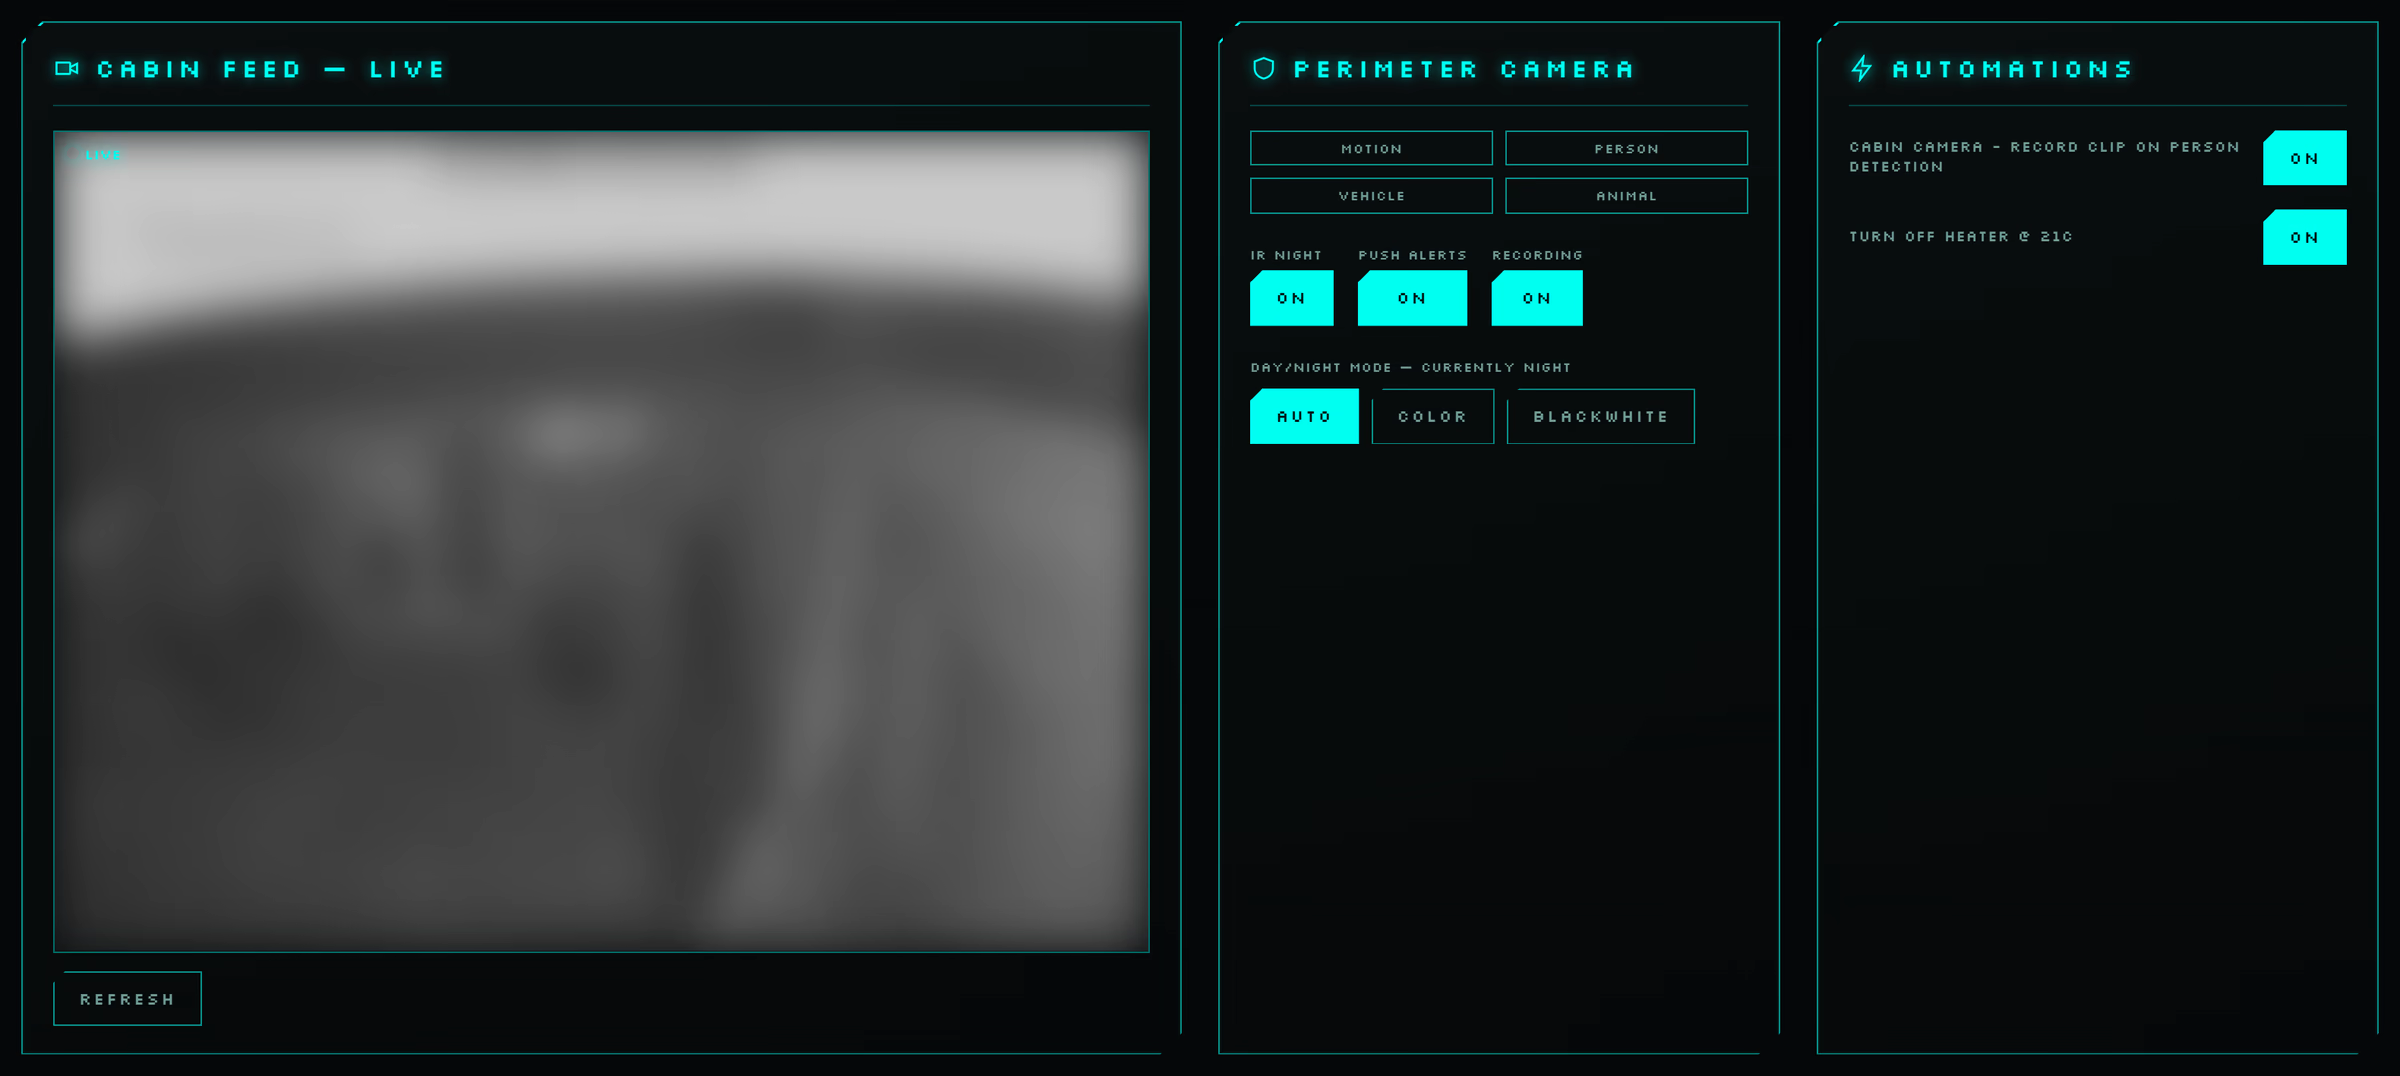
A live snapshot every 10 seconds, IR, alert and recording toggles, and switches to enable or disable existing automations.
Network
Monitor
The stock Speedtest.net integration kept picking a test server in Lagos and failing. So the project includes its own Home Assistant app, written in Python, that measures the cabin's connection and publishes the results over MQTT.
It pings three public resolvers every minute for latency, jitter and packet loss, and runs a speed test against Cloudflare's nearest edge every three hours. MQTT discovery turns the results into proper Home Assistant entities, including a button the dashboard presses to run a test on demand.
How It Connects
Browser
The browser only ever talks to the dashboard's own API routes. It never sees Home Assistant directly, and never holds its token.
Proxy
Next.js API routes hold the Home Assistant token server-side. Every request is checked against an allow-list of entities and services; anything else returns 403.
Tunnel
The proxy reaches Home Assistant's REST and WebSocket APIs through a Cloudflare tunnel, so nothing in the cabin is exposed to the open internet.
Home Assistant
Runs on a Raspberry Pi 4 with Zigbee, Reolink, Android TV and MQTT integrations. The Network Monitor app reports into it over MQTT.
Polling
Device states refresh every 4 seconds, charts every 30–60 seconds, the logbook every 30 seconds and the forecast every 10 minutes.
Technical Details
Engineering Notes
Sparse History
Home Assistant only records a value when it changes, so straight lines drew misleading ramps on power charts. Event-driven sensors now use step charts that hold the last value.
The 24-Hour Cliff
The history API silently stops 24 hours after the start time unless an end time is given. Multi-day queries returned nothing until it was set explicitly.
Bot Protection
Cloudflare's speed endpoints returned 403 to a plain script. Reproduced locally, fixed with browser-style headers and a UK-hosted fallback.
Video Through Serverless
Clips stream through the authenticated proxy with Range headers passed through, so seeking works. Filenames are validated to prevent path traversal.
Data Hygiene
Failed speed tests and 0 V readings from switched-off plugs are filtered out so they don't drag charts to the floor.
Hydration
No Date.now() in the initial render, so server and client markup always agree.